
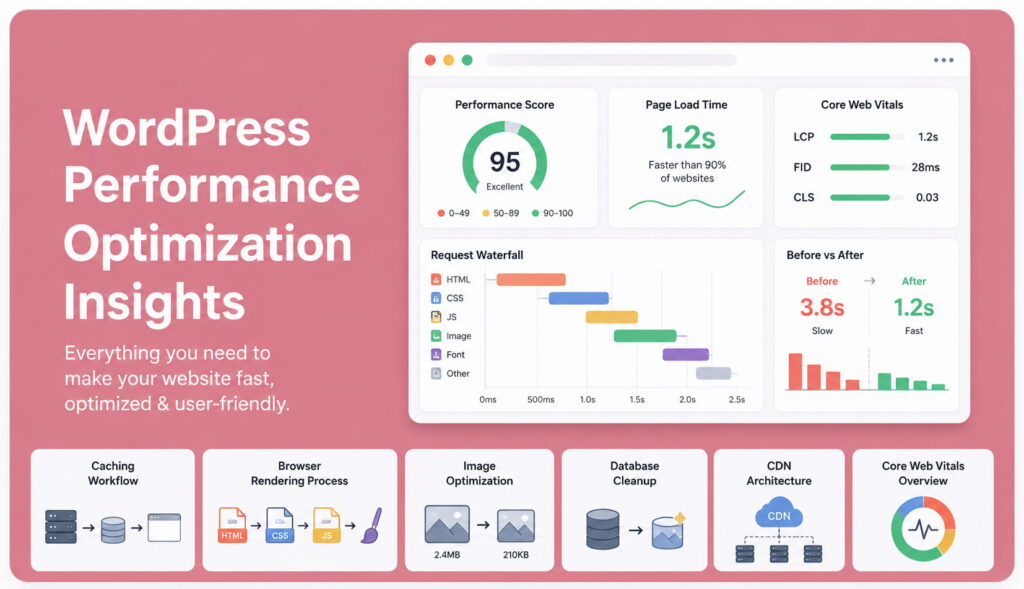
Somebody on your team has probably already said the sentence: “the site just feels slow.” Nobody can point to why. The images seem fine. The host says everything’s fine. The theme demo loaded fast on the sales page. And yet PageSpeed Insights comes back with a score in the 40s and a support ticket from a customer who gave up on checkout.
Here’s the thing worth sitting with before we go any further: WordPress itself is not slow. A default WordPress install with a stock theme and no plugins loads in well under a second on almost any hosting. The slowness you’re dealing with was added — one plugin, one uncompressed hero image, one embedded chat widget at a time. Nobody sat down and decided to make the site slow. It happened gradually, the way a garage fills up with things that each individually seemed worth keeping.
That’s actually good news, because it means the fix isn’t “rebuild everything.” It’s finding the specific handful of things — usually three to six — that are doing most of the damage, and dealing with those first. This guide walks through 25 of the most common culprits, in enough technical depth that you can actually diagnose your own site rather than guessing. For each one we’ll cover why it happens, how to detect it on your own site, what tools to use, how to fix it, and roughly how much speed you can expect to get back.
A quick note on how to use this article: don’t try to fix all 25 in one afternoon. Read through the list once, run the diagnostics against your own site, and you’ll probably find that four or five of these are doing 80% of the damage. Start there.
2. Why Website Speed Actually Matters (Beyond “Google Likes Fast Sites”)
It’s tempting to treat speed as a ranking checkbox — get the PageSpeed score up, move on. That undersells what’s actually happening. Speed affects three separate things, and they compound.
It affects whether people stay. Every extra second before a page becomes usable is a chance for a visitor to bail, especially on mobile, especially on a slower connection than the one your office Wi-Fi gives you when you’re testing.
It affects whether people buy. On WooCommerce stores specifically, a sluggish cart or checkout step doesn’t just annoy people — it interrupts the moment of intent. Someone who was ready to pay a second ago is now waiting, and waiting invites reconsideration.
It affects how Google evaluates the page. Core Web Vitals are a ranking input, not the whole algorithm, but they’re a real one — and more importantly, they’re a proxy for the same experience quality that affects the first two points. Fixing speed for Google and fixing speed for humans is, in almost every case, the same work.
The mistake I see most often is treating these as separate problems — optimizing narrowly for a PageSpeed number while ignoring what a real visitor on a mid-range Android phone over 4G actually experiences. Chase the real experience, and the score follows.
3. How Google Measures Your Site’s Performance
Google doesn’t score your site by looking at a single lab test. It blends two very different kinds of data, and mixing them up is the source of a lot of confused optimization work.
Lab data comes from a controlled test — a simulated device, a simulated connection speed, run once, right now. Tools like PageSpeed Insights and Lighthouse produce lab data. It’s useful for debugging because it’s consistent and repeatable, but it’s not what your actual visitors experienced.
Field data (Google calls this the Chrome User Experience Report, or CrUX) comes from real Chrome users who actually visited your site over the past 28 days, on their actual devices and actual connections. This is what Google primarily uses for the Core Web Vitals ranking signal, and it’s the number that matters most — because it’s real.
It’s entirely possible to have a great Lighthouse score and mediocre field data, usually because your test device is faster than your average visitor’s phone, or because a slow-loading page only shows up for people on 3G in regions your test never simulates. If the two disagree, trust the field data — it’s telling you what’s actually happening.
4. How to Measure Your Own Site’s Speed
Before changing anything, get a baseline. Otherwise you won’t know whether a fix actually helped or you’re just imagining it did.
Google PageSpeed Insights — gives you both lab and field data (if your site has enough traffic to appear in CrUX) plus specific, itemized opportunities for improvement. Start here.
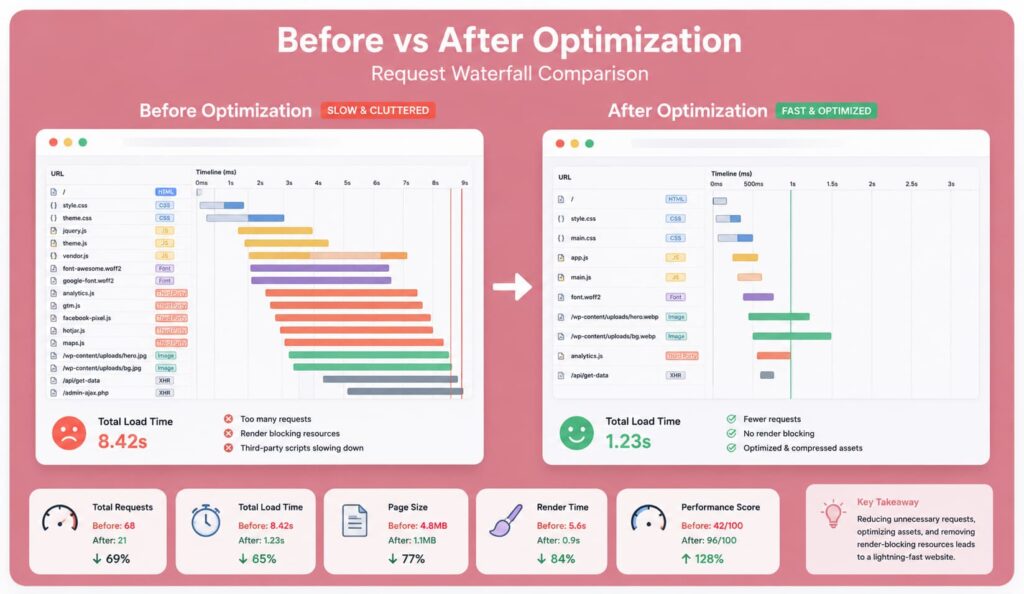
GTmetrix — particularly useful for the request waterfall view, which shows you exactly what’s loading, in what order, and how long each request takes. This is where you’ll actually spot the 6MB image or the font file that’s blocking everything behind it.
WebPageTest — the most detailed option, letting you test from specific geographic locations and connection speeds, and it produces a filmstrip view showing exactly what the page looked like frame by frame as it loaded.
Chrome DevTools (built into your browser) — free, and the Network and Performance tabs let you inspect your own site’s loading behavior directly, including which specific plugin or script is responsible for a slow request.
Run the same test at least three times and take the median result — a single test run can be thrown off by a temporary network blip that has nothing to do with your site.
5. Core Web Vitals, Explained Without the Jargon
There are three Core Web Vitals metrics, and each one measures a different kind of “slow.”
LCP (Largest Contentful Paint) measures how long it takes for the biggest visible element on the screen — usually a hero image or headline — to fully render. This is your “does the page look loaded yet” metric. Google considers under 2.5 seconds good.
INP (Interaction to Next Paint) measures how long the page takes to visibly respond after someone clicks, taps, or types. This replaced the older First Input Delay metric because it captures responsiveness across the entire page visit, not just the first interaction. Under 200 milliseconds is good.
CLS (Cumulative Layout Shift) measures visual stability — how much content jumps around as the page finishes loading. This is the metric behind that frustrating moment where you go to tap a button and an ad loads above it, shifting everything down right as you tap. Under 0.1 is good.
Each of these has different causes, which is exactly why “just install a caching plugin” doesn’t fix everything — caching mostly helps TTFB and load time, but does very little for CLS caused by an ad slot with no reserved space.
6. TTFB — The Metric Almost Nobody Checks First
Time to First Byte measures how long it takes your server to send back the very first byte of the response, before your browser has even started rendering anything. It’s upstream of everything else — if TTFB is slow, every other metric inherits that delay.
TTFB is almost entirely a server-side story: hosting quality, PHP version, database query speed, and whether a cached version of the page exists. This is precisely why an image-heavy site can sometimes fix its LCP by addressing TTFB rather than touching a single image — if the server takes 2 seconds just to start responding, no amount of image compression closes that gap.
A good target is under 200ms for a cached page; anything over 600ms on a regular basis usually points to a hosting or database problem, not a front-end one, and no plugin will fully mask that.
7. Page Load Time vs. Perceived Speed
“Load time” as a single number is a bit of a fiction. What actually matters to a visitor is perceived speed — does the page feel fast, regardless of when the browser technically fires its “load” event.
A page can finish “loading” in the technical sense at 4 seconds but feel instant if the visible content above the fold rendered at 1 second and everything else loaded quietly in the background. Conversely, a page can technically load in 2 seconds but feel sluggish if the layout keeps jumping or a critical button stays unresponsive for an extra second after everything looks visually done.
This is why Core Web Vitals moved toward metrics like LCP and INP instead of a single blunt “time to fully loaded” number — they’re trying to measure the experience, not just the stopwatch.
8. The 25 Hidden Reasons Your Site Is Slow
1. Cheap or Unsuitable Hosting
Why It Happens Hosting is usually the first purchase a new site owner makes, often before they understand what their site will actually need. Budget shared hosting is cheap because a single physical server is split across hundreds or thousands of accounts, all competing for the same CPU and memory.
How It Slows WordPress Every PHP request WordPress handles — rendering a page, processing a form, running a plugin’s background task — has to wait for its turn on shared server resources. When a neighboring account on the same server spikes in traffic, your site’s response time spikes with it, even though nothing on your end changed.
Real World Example A WooCommerce store on a $4/month shared plan runs fine most of the month, then grinds to a crawl every time a completely unrelated site on the same server gets a traffic surge from a viral post.
How To Detect It Inconsistent TTFB — fast at 3am, slow at peak hours — is the classic fingerprint of resource contention on shared hosting. A dedicated or well-provisioned server tends to have TTFB that stays fairly flat regardless of time of day.
Tools To Use GTmetrix or WebPageTest run at different times of day; your host’s own resource usage dashboard if it offers one.
How To Fix It Move to hosting with dedicated resources appropriate to your traffic — this doesn’t have to mean an expensive dedicated server; many mid-tier managed WordPress hosts provide guaranteed resource allocations at a reasonable price.
Best Practice Match hosting tier to actual traffic and complexity, not to what felt affordable on day one. Revisit the decision as the site grows rather than treating the original hosting choice as permanent.
Estimated Performance Improvement Often the single biggest win available — TTFB improvements of 50–80% are common when moving off severely oversold shared hosting.
Difficulty Moderate (requires a migration, but most hosts offer migration assistance).
2. Outdated PHP Version
Why It Happens Sites get set up once and then largely left alone. The PHP version active at setup time often just stays there for years, since upgrading isn’t something WordPress prompts loudly for.
How It Slows WordPress Each major PHP version has brought substantial performance improvements at the language level — code simply executes faster on newer PHP, independent of anything you do in WordPress itself. Older PHP versions also lose official support, meaning even routine security patches stop coming.
Real World Example A blog running on PHP 7.4 (long past its supported life) processes each page request meaningfully slower than the identical site would on a current, supported PHP version — with zero code changes required to get that improvement.
How To Detect It WordPress → Tools → Site Health flags an outdated PHP version directly and tells you which version you’re currently running.
Tools To Use Site Health (built into WordPress); your hosting control panel’s PHP version selector.
How To Fix It Request or select a current, supported PHP version through your hosting control panel. Test the site afterward, since occasionally an old, poorly maintained plugin will show compatibility warnings.
Best Practice Treat PHP version as something to review at least annually, and immediately whenever your host announces a new version is available.
Estimated Performance Improvement Typically a 10–30% improvement in server-side processing time, on top of closing security gaps.
Difficulty Easy (usually a single dropdown change in hosting control panel).
3. No Page Caching
Why It Happens Without caching, WordPress rebuilds every page from scratch on every single visit — querying the database, running PHP, assembling the HTML — even if the page hasn’t changed since the last visitor saw it five minutes ago.
How It Slows WordPress This is pure, repeated, unnecessary work. A cached static HTML file can be served in milliseconds; a fully dynamic PHP-generated page can take several hundred milliseconds to multiple seconds depending on complexity, and that cost is paid by every single visitor.
Real World Example A blog post that gets linked from a large newsletter suddenly receives a spike in traffic. Without caching, every one of those visitors triggers a full database query and PHP execution cycle simultaneously, and the server buckles under load that page caching would have absorbed instantly.
How To Detect It Check response headers for cache indicators (X-Cache: MISS on repeated loads is a red flag), or simply check whether a caching plugin is installed and actually configured, not just present but inactive.
Tools To Use Browser DevTools Network tab (inspect response headers); GTmetrix (compare TTFB on repeat visits).
How To Fix It Install a reputable caching plugin, or confirm your managed host provides server-level page caching (many do, and in that case a plugin-based cache can actually conflict with it). Configure cache exclusions correctly for dynamic pages like the cart and checkout.
Best Practice Prefer server-level caching over plugin-based caching when your host offers it — it operates before PHP even loads, making it faster still.
Estimated Performance Improvement Often the single most dramatic single-change improvement available — TTFB drops of 70%+ are typical going from no cache to a properly configured page cache.
Difficulty Easy to Moderate (installation is easy; correct configuration around dynamic content takes some care).
4. No Object Caching
Why It Happens Page caching handles full HTML pages, but it doesn’t help logged-in users, WooCommerce carts, or any dynamic, personalized content — those requests still hit the database directly unless a separate layer, object caching, is in place.
How It Slows WordPress WordPress repeats the same database queries constantly across a single page load (and across different page loads) — object caching stores the results of those queries in memory so they don’t need to be recalculated every time. Without it, a busy site re-runs identical, expensive queries over and over.
Real World Example A membership site where logged-in users can’t benefit from page caching sees dashboard and account pages loading noticeably slower than the public-facing blog, because every logged-in request re-queries the database from scratch.
How To Detect It Query Monitor (a free plugin) shows exactly how many database queries a page is running and how long they take — a high query count with no object cache in place is a clear signal.
Tools To Use Query Monitor; your hosting dashboard (to check whether Redis or Memcached is available).
How To Fix It Enable Redis or Memcached object caching if your host supports it, paired with a compatible object cache plugin (or drop-in) to connect WordPress to it.
Best Practice Object caching matters most for logged-in-heavy sites (membership sites, WooCommerce with frequent account activity) — prioritize it there first if resources are limited.
Estimated Performance Improvement 20–50% improvement on dynamic, logged-in, or database-heavy page types specifically.
Difficulty Moderate (usually requires hosting support for Redis/Memcached, plus plugin configuration).
5. Poor Database Health and Query Performance
Why It Happens As a site grows — more posts, more products, more plugins each adding their own tables and queries — the database accumulates complexity that was never present when the site was small and fast.
How It Slows WordPress Slow, unoptimized, or excessive database queries directly inflate TTFB, since WordPress can’t finish generating a page until every required query returns. A single poorly written plugin query can add hundreds of milliseconds on its own.
Real World Example A WooCommerce store with years of order history sees its admin order screen slow to a crawl, because the underlying queries scan a massively grown, never-indexed table.
How To Detect It Query Monitor flags slow queries directly and identifies which plugin or theme function triggered them.
Tools To Use Query Monitor; your hosting provider’s slow query log, if available.
How To Fix It Identify the specific slow queries via Query Monitor, then address the source — often a specific plugin querying inefficiently. Work with a developer to add database indexes where queries are scanning large tables without one.
Best Practice Review Query Monitor’s output periodically, not just when something feels obviously slow — catching a creeping problem early is easier than fixing an entrenched one.
Estimated Performance Improvement Highly variable, but fixing a genuinely bad query can single-handedly cut TTFB by hundreds of milliseconds.
Difficulty Hard (usually needs developer-level database knowledge).
6. Large, Unoptimized Images
Why It Happens Images come straight from a phone camera or a stock photo site at full resolution, get uploaded directly to WordPress, and get displayed at a fraction of their actual pixel dimensions — the browser downloads the full file regardless.
How It Slows WordPress Images are typically the single largest contributor to total page weight. A multi-megabyte hero image directly delays LCP, since it’s very often the largest visible element the browser is trying to render.
Real World Example A homepage loading a 6MB hero image straight out of a DSLR camera, displayed at a modest 1200px wide — the visitor’s browser is downloading pixel data many times larger than what’s ever actually shown on screen.
How To Detect It PageSpeed Insights explicitly flags “properly size images” and “efficiently encode images” as opportunities, listing the exact files and potential savings.
Tools To Use PageSpeed Insights; GTmetrix; browser DevTools Network tab sorted by file size.
How To Fix It Resize images to their actual maximum display dimensions before upload, and use an image optimization plugin or build-step tool to compress them further without visible quality loss.
Best Practice Establish a maximum upload dimension as a habit (or an automated resize rule) so oversized images never enter the media library in the first place.
Estimated Performance Improvement Can cut total page weight by 50%+ on image-heavy pages, often improving LCP by a full second or more.
Difficulty Easy.
7. No Image Compression
Why It Happens Even a correctly sized image can still carry unnecessary file weight if it hasn’t been compressed — most images straight from a camera or design tool use conservative, quality-preserving compression settings meant for print or archival use, not the web.
How It Slows WordPress Every uncompressed kilobyte is data the visitor’s browser has to download before it can render — compression can often cut file size by 60–80% with no visible difference to the human eye.
Real World Example A product photo gallery on a WooCommerce store loads 40 full-quality PNG images on a single category page, when compressed JPEGs or WebP files of visually identical quality would be a fraction of the size.
How To Detect It Compare a sample image’s current file size against what an optimization tool suggests is achievable at the same visual quality.
Tools To Use An image optimization plugin (running compression automatically on upload); Squoosh (Google’s free web-based compression tool) for manual spot checks.
How To Fix It Install an image optimization plugin configured to compress automatically on upload, then run a bulk optimization pass over your existing media library.
Best Practice Use “lossy” compression at a quality setting around 75–85% for most photographic images — the file size savings are substantial and the visible quality loss is negligible at that range.
Estimated Performance Improvement 30–60% reduction in image file sizes typically, translating directly into faster LCP and lower total page weight.
Difficulty Easy.
8. No Next-Gen Image Formats (WebP/AVIF)
Why It Happens JPEG and PNG have been the default web image formats for decades, and most content management workflows never prompt anyone to switch — images just get uploaded in whatever format the source file already used.
How It Slows WordPress WebP typically produces files 25–35% smaller than an equivalent-quality JPEG; AVIF often goes further still, sometimes 50% smaller than JPEG at comparable visual quality. Sticking with older formats leaves that savings entirely on the table.
Real World Example A photography portfolio site serving JPEG images exclusively could cut its total image payload by roughly a third simply by serving the same images as WebP, with browsers that support it receiving the smaller file automatically.
How To Detect It PageSpeed Insights explicitly flags “serve images in next-gen formats” when it detects JPEG/PNG images that could be served as WebP or AVIF instead.
Tools To Use PageSpeed Insights; an image optimization plugin that supports automatic WebP/AVIF conversion and serving.
How To Fix It Enable WebP/AVIF conversion in your image optimization plugin, which typically serves the next-gen format to supporting browsers automatically while falling back to the original format for older browsers — no manual work required per image.
Best Practice Let the plugin handle format negotiation automatically rather than manually converting and re-uploading images — automatic fallback support matters for the small remaining share of older browsers.
Estimated Performance Improvement An additional 20–40% reduction in image weight on top of standard compression.
Difficulty Easy.
Comparison Table: JPEG vs. WebP vs. AVIF
| Format | Typical File Size (vs. JPEG) | Browser Support | Best For |
|---|---|---|---|
| JPEG | Baseline | Universal | Maximum compatibility |
| WebP | ~25–35% smaller | Very broad (all modern browsers) | Default choice for most sites today |
| AVIF | ~40–50% smaller | Broad, growing | Sites prioritizing maximum compression, with fallback in place |
9. Too Many Web Fonts
Why It Happens Page builders and themes make adding a new font trivially easy, and it’s common for a site to accumulate a different heading font, a different body font, a decorative font for one campaign banner, and a leftover font from a theme that was switched out months ago.
How It Slows WordPress Every additional font file is an additional network request, and fonts specifically can block text rendering until they load (depending on how they’re implemented), directly delaying when visible content appears.
Real World Example A website loading 18 Google Fonts across its various page builder elements — most of them unused remnants from testing different design directions — each one adding a render-blocking request to every single page load.
How To Detect It GTmetrix’s waterfall view will show a cluster of font file requests; count distinct font families and weights actually loaded on a typical page.
Tools To Use GTmetrix; browser DevTools Network tab filtered to font files.
How To Fix It Audit and consolidate to two font families maximum (one for headings, one for body text), and load only the specific weights actually used rather than the full weight range.
Best Practice Pick your font system early in a design process and resist adding “just one more” font for a single campaign or section — the cumulative cost adds up fast.
Estimated Performance Improvement Reducing from a dozen-plus fonts to two or three typically saves several hundred milliseconds of render-blocking time.
Difficulty Easy to Moderate.
10. Google Fonts Loaded the Wrong Way
Why It Happens The default way many themes and page builders implement Google Fonts pulls the font files from Google’s own servers at render time, rather than hosting them locally alongside the rest of the site’s assets.
How It Slows WordPress This requires the browser to open a brand-new connection to an entirely separate domain (fonts.googleapis.com), incurring DNS lookup, connection, and TLS negotiation time on top of the font download itself — all before the text using that font can render.
Real World Example A blog using a theme that loads its heading font directly from Google’s servers sees a visible flash of unstyled or invisible text while that separate connection is established, especially on slower connections.
How To Detect It Check the Network tab for requests to fonts.googleapis.com or fonts.gstatic.com.
Tools To Use Browser DevTools Network tab; PageSpeed Insights (“eliminate render-blocking resources” often flags externally loaded fonts).
How To Fix It Self-host your Google Fonts by downloading the font files and serving them from your own domain, removing the separate external connection entirely. Several plugins automate this process.
Best Practice Combine self-hosting with font-display: swap in your CSS so text remains visible using a fallback font while the custom font loads, rather than staying invisible.
Estimated Performance Improvement Removing one external domain connection typically saves 100–300ms, and self-hosting eliminates a recurring dependency on a third party’s uptime.
Difficulty Moderate.
11. Heavy, Bloated Theme
Why It Happens Multipurpose “do everything” themes bundle enormous amounts of functionality — dozens of layout options, built-in sliders, portfolio systems, and page-builder integrations — most of which any individual site never actually uses.
How It Slows WordPress All of that bundled functionality typically loads its associated CSS and JavaScript regardless of whether the current page uses it, adding dead weight to every single page load.
Real World Example A simple five-page business site running a massive multipurpose theme originally chosen for its demo designs ends up loading megabytes of CSS and JS supporting portfolio grids, sliders, and layout options the site never actually uses anywhere.
How To Detect It Compare total CSS/JS file size in DevTools against what a genuinely lightweight theme would load for a comparable page — a large gap with no corresponding functionality being used is the tell.
Tools To Use PageSpeed Insights (flags unused CSS/JS by file); browser DevTools Coverage tab (shows exactly what percentage of loaded CSS/JS is actually used on the current page).
How To Fix It Switch to a genuinely lightweight, purpose-built theme, or if switching isn’t feasible, disable unused theme modules/features where the theme provides that option.
Best Practice Choose themes based on what the site actually needs, not how impressive the demo library looks — a narrower, well-coded theme almost always outperforms a sprawling multipurpose one.
Estimated Performance Improvement Switching from a heavy multipurpose theme to a lightweight one commonly cuts front-end asset weight by 40–70%.
Difficulty Hard (theme changes require careful testing of layout and functionality).
Comparison Table: Heavy Theme vs. Lightweight Theme
| Attribute | Heavy Multipurpose Theme | Lightweight Theme |
|---|---|---|
| Typical CSS/JS size | Several hundred KB to MB+ | Tens to low hundreds of KB |
| Built-in features | Extensive, mostly unused per-site | Minimal, focused |
| Customization approach | Built-in options panel | Often relies on block editor / lighter tooling |
| Update complexity | Higher (large codebase) | Lower |
| Typical performance impact | Meaningful drag on load time | Minimal overhead |
12. Unused CSS
Why It Happens Themes and plugins each load their own stylesheet, often the entire stylesheet, regardless of whether the current page actually uses more than a small fraction of the rules inside it.
How It Slows WordPress The browser has to download and parse all of that CSS before it can finish rendering the page, even the parts of it that apply to elements never present on the page currently loading.
Real World Example A page builder generating a 2MB CSS file that includes styling for every possible layout element the builder supports, when any individual page only uses a small subset of those elements.
How To Detect It Chrome DevTools’ Coverage tab shows exactly what percentage of each loaded CSS file is actually applied to the current page — a large red (unused) bar is the signal.
Tools To Use Chrome DevTools Coverage tab; PageSpeed Insights (“reduce unused CSS”).
How To Fix It Use a performance plugin’s CSS optimization feature to generate page-specific critical CSS, or manually dequeue stylesheets from pages/plugins that don’t need them.
Best Practice Address this after settling on your final theme and plugin set — optimizing CSS delivery before your plugin stack is finalized means redoing the work later.
Estimated Performance Improvement Meaningful reduction in render-blocking time; exact gains vary widely based on how much excess CSS exists.
Difficulty Moderate to Hard.
13. Unused JavaScript
Why It Happens Similar to CSS — plugins each load their own JavaScript files, often in full, even on pages where that plugin’s functionality isn’t present or used at all.
How It Slows WordPress JavaScript is more expensive than CSS to process — the browser doesn’t just download it, but parses and executes it, which directly consumes the main thread and can delay interactivity (affecting INP).
Real World Example A contact form plugin loading its validation and submission scripts on every single page of the site, even pages that don’t contain a contact form anywhere.
How To Detect It Chrome DevTools Coverage tab, same as CSS — look for JavaScript files with a high percentage of unused code on the current page.
Tools To Use Chrome DevTools Coverage tab; PageSpeed Insights (“reduce unused JavaScript”).
How To Fix It Configure plugins to only load their scripts on pages where they’re actually needed (many well-coded plugins offer this as a setting); use a performance plugin’s script management feature to manually control this for plugins that don’t.
Best Practice When evaluating a new plugin before installing it, check whether it loads assets conditionally or globally — this is a meaningful, often-overlooked quality signal.
Estimated Performance Improvement Can meaningfully improve INP and reduce main-thread work, especially on script-heavy pages.
Difficulty Moderate to Hard.
14. Too Many Plugins
Why It Happens Plugins solve problems one at a time, and it’s easy to add a new one for each new need without ever revisiting whether an older plugin is still necessary or whether its function could be consolidated.
How It Slows WordPress Each active plugin adds its own database queries, its own CSS/JS assets, and its own hooks into WordPress’s execution process — the cumulative effect compounds even if each individual plugin seems lightweight on its own.
Real World Example A WooCommerce store running 180 active plugins accumulated over several years of “just add a plugin for that” — the admin dashboard alone takes visibly longer to load than the actual storefront, because so much is initializing on every request.
How To Detect It Query Monitor shows total query count and page generation time, which climbs plugin by plugin — disable plugins in a staging environment one at a time (or in batches) to isolate the heaviest contributors.
Tools To Use Query Monitor; Plugin Organizer or similar plugin-management tools for conditional loading.
How To Fix It Audit the full plugin list, identify redundant or unused ones, and remove them. For plugins doing genuinely simple things, consider whether a small code snippet could replace the plugin’s overhead entirely.
Best Practice Every plugin addition should be a deliberate decision weighed against its performance cost, not a reflexive solution — ask whether existing tools can already do this before installing something new.
Estimated Performance Improvement Highly variable depending on which plugins are removed, but consolidating from an excessive count often yields double-digit percentage improvements in page generation time.
Difficulty Moderate (requires careful testing to avoid breaking functionality).
15. Poorly Coded Plugins
Why It Happens Not all plugins are written with performance in mind — some run expensive, unoptimized database queries, load unnecessary assets globally, or make external API calls synchronously during page load.
How It Slows WordPress A single poorly coded plugin can outweigh the combined impact of a dozen well-written ones — it’s not about plugin count alone, but about the quality of what each plugin is actually doing.
Real World Example A single “related posts” plugin runs an expensive, unindexed database query on every single page load to calculate recommendations in real time, rather than caching the results — quietly adding several hundred milliseconds to every page on the site.
How To Detect It Query Monitor attributes query time and count directly to the specific plugin responsible, making the worst offenders easy to identify.
Tools To Use Query Monitor; New Relic or a similar application performance monitoring tool for a more detailed production-level view.
How To Fix It Replace the poorly performing plugin with a better-coded alternative offering similar functionality, or work with a developer to patch the specific inefficient behavior if replacement isn’t feasible.
Best Practice Before adopting a new plugin, check its support forum and changelog for performance-related complaints, and test its impact on staging before deploying to production.
Estimated Performance Improvement Can be dramatic — removing a single badly behaved plugin has, in some cases, cut page generation time in half.
Difficulty Moderate to Hard.
16. Large DOM Size
Why It Happens Page builders, nested sections, and deeply layered design elements can quietly generate an enormous number of individual HTML elements — a “simple looking” page built with a visual builder can easily contain thousands of nested div elements under the hood.
How It Slows WordPress The browser has to construct, style, and paint every single element in the DOM. A large, deeply nested DOM increases memory usage and slows down style recalculation and layout, which particularly hurts INP when JavaScript needs to interact with a large tree of elements.
Real World Example A landing page built entirely with a drag-and-drop builder, with rows nested inside columns nested inside sections nested inside more sections, ends up with over 3,000 DOM elements for what visually looks like a fairly simple one-page layout.
How To Detect It Chrome DevTools’ Lighthouse audit explicitly flags “Avoid an excessive DOM size” and reports the exact element count; anything above roughly 1,500 elements is worth investigating, and above 3,000 is a clear problem.
Tools To Use Lighthouse (via PageSpeed Insights or DevTools); browser DevTools Elements panel to inspect nesting depth directly.
How To Fix It Simplify page builder layouts by reducing unnecessary nested wrapper sections, and consider rebuilding especially heavy pages using more efficient block structures rather than deeply layered builder elements.
Best Practice When designing in a page builder, periodically check the actual generated HTML rather than just the visual editor — builders can generate far more markup than a design appears to need.
Estimated Performance Improvement Can meaningfully improve INP and rendering performance on especially DOM-heavy pages, though gains vary by how excessive the original DOM was.
Difficulty Hard (often requires rebuilding page sections).
17. External Scripts and Third-Party Requests
Why It Happens Analytics tools, marketing pixels, embedded widgets, and various integrations each require loading a script from an external domain — and these accumulate over time as new tools get added for different purposes.
How It Slows WordPress Each external domain requires its own DNS lookup, connection, and TLS handshake, and — critically — the performance of these requests is entirely outside your control, since they depend on the third party’s own server speed.
Real World Example A contact form plugin loading scripts on every single page of the site, combined with a marketing pixel, a review widget, and an analytics tool each pulling from a different external domain — none individually huge, but collectively adding up to a dozen extra connections on every page.
How To Detect It The GTmetrix or WebPageTest waterfall view clearly separates first-party and third-party requests, making it easy to see how much of total load time is attributable to external domains.
Tools To Use GTmetrix; WebPageTest; PageSpeed Insights (“reduce the impact of third-party code”).
How To Fix It Audit every third-party script for whether it’s still actually needed, remove unused ones, and load remaining necessary scripts asynchronously or deferred so they don’t block rendering of your own content.
Best Practice Review third-party scripts quarterly — marketing and analytics tools accumulate the same way plugins do, and old ones rarely get removed even after they stop being useful.
Estimated Performance Improvement Varies by how many scripts are removed, but third-party code is frequently among the largest contributors to poor INP scores specifically.
Difficulty Moderate.
18. Third-Party Ad Scripts
Why It Happens Ad networks require their own JavaScript to load, target, and render ads dynamically, and the auction/bidding process behind programmatic advertising involves multiple sequential network requests before an ad even appears.
How It Slows WordPress Ad scripts are notoriously heavy on both load time and layout stability — they often reserve no space initially, then insert content once the ad resolves, causing a visible layout shift that directly hurts CLS.
Real World Example A content site running three different ad networks simultaneously sees a visible jump in page content every time an ad slot finally resolves and inserts its content above the article text the visitor was already reading.
How To Detect It CLS score in PageSpeed Insights combined with visually observing the page load — ad-related shifts are usually easy to spot once you know to look for them.
Tools To Use PageSpeed Insights (CLS metric and its specific “shifted elements” report); Chrome DevTools Performance panel.
How To Fix It Reserve explicit space for ad containers using CSS (a fixed minimum height/width) so the layout doesn’t shift when the ad loads, and load ad scripts asynchronously rather than blocking other content.
Best Practice Balance ad revenue against user experience deliberately — an ad setup that tanks Core Web Vitals can hurt both rankings and the very engagement the ads are trying to monetize.
Estimated Performance Improvement Reserving ad space alone often resolves the majority of ad-related CLS issues without reducing ad revenue.
Difficulty Moderate.
19. Chat Widgets Loading Everywhere
Why It Happens Live chat and support widget scripts are typically installed site-wide via a single snippet in the header or footer, without considering whether every page actually benefits from having the widget present.
How It Slows WordPress Chat widgets are often surprisingly heavy — they can pull in their own CSS, JavaScript, web fonts, and sometimes even set up a persistent connection, all before a visitor has shown any intent to actually use the chat feature.
Real World Example A support chat widget installed site-wide loads its full script bundle even on the blog’s static “About” and “Privacy Policy” pages, where the odds of anyone opening the chat are essentially zero.
How To Detect It Check the Network tab on pages where chat functionality provides little value and see whether the widget script still loads there.
Tools To Use Browser DevTools Network tab; PageSpeed Insights (“reduce the impact of third-party code” often flags chat widget scripts specifically).
How To Fix It Load the chat widget conditionally — for example, only on high-intent pages like pricing or checkout — or delay its loading until the visitor scrolls or after a short delay, rather than loading it immediately on every page.
Best Practice Many modern chat tools offer a “lazy load” or delayed-initialization option specifically for this reason — check your provider’s settings before assuming site-wide immediate loading is the only option.
Estimated Performance Improvement Removing an unnecessary widget from low-value pages can meaningfully reduce third-party script weight sitewide.
Difficulty Easy to Moderate.
20. Slow DNS Resolution
Why It Happens DNS is the step where a visitor’s browser translates your domain name into a server IP address, and it happens before any other part of the page can begin loading — but it’s frequently overlooked because it happens invisibly, before anything the site owner directly sees.
How It Slows WordPress A slow or poorly configured DNS provider adds delay before the very first connection to your server even begins, which means it delays everything downstream, including TTFB.
Real World Example A site using its domain registrar’s free, basic DNS service — not built for speed — experiences DNS lookup times several times slower than what a dedicated, performance-focused DNS provider would deliver, adding avoidable delay to every single visit.
How To Detect It WebPageTest’s detailed request breakdown shows DNS lookup time as a distinct phase at the very start of the waterfall.
Tools To Use WebPageTest; DNS-specific lookup speed testing tools.
How To Fix It Switch to a reputable, performance-focused DNS provider (many CDN services include fast DNS as part of their offering).
Best Practice This is a “set it once and mostly forget it” fix — worth doing early, since it benefits every single page on the site with no ongoing maintenance required.
Estimated Performance Improvement Usually a modest but consistent gain — tens of milliseconds per visit, but applied to every single request across the entire site.
Difficulty Easy.
21. Missing CDN
Why It Happens Without a CDN (Content Delivery Network), every visitor’s request travels all the way to your single origin server, regardless of how far away they physically are from it.
How It Slows WordPress Physical distance translates directly into latency — a visitor in a different region or country than your server experiences meaningfully slower load times purely due to the extra distance the data has to travel, on top of any other performance factors.
Real World Example A site hosted on a server in one country serves visitors from a completely different continent noticeably slower than local visitors, purely due to geographic distance, even though the server itself is performing well.
How To Detect It Test your site’s load time from multiple geographic locations using a tool that allows location selection, and compare results.
Tools To Use WebPageTest (location selector); GTmetrix (test region selector).
How To Fix It Set up a CDN to serve static assets (and often full pages) from servers geographically distributed closer to your visitors, reducing the distance data has to travel.
Best Practice Choose a CDN with a point of presence network that actually covers your primary visitor geography — check where your traffic comes from before assuming any CDN provider is equivalent.
Estimated Performance Improvement Can be substantial for geographically distributed audiences — sometimes cutting load time by half or more for visitors far from the origin server.
Difficulty Moderate.
22. Database Bloat
Why It Happens WordPress accumulates data over time that was never meant to stick around permanently — post revisions, expired transients, spam comments, and orphaned data left behind by uninstalled plugins all quietly pile up in the database.
How It Slows WordPress A larger database means every query — even a simple one — has more data to search through, and backups take longer too. None of this bloat serves any ongoing functional purpose; it’s pure accumulated weight.
Real World Example A blog that’s been publishing for several years without ever cleaning up post revisions discovers its wp_posts table contains far more revision entries than actual published content, all of it silently inflating every content-related query.
How To Detect It Check your database size via your hosting control panel or a database management plugin, and compare table row counts — an unusually large wp_posts, wp_options, or wp_postmeta table relative to actual content volume is the signal.
Tools To Use A database optimization/cleanup plugin; phpMyAdmin (or your host’s database tool) for direct inspection.
How To Fix It Clean up post revisions (optionally limiting how many WordPress keeps going forward), remove expired transients, delete spam/trash comments, and remove leftover tables from long-uninstalled plugins.
Best Practice Schedule database cleanup as a recurring maintenance task rather than a one-time fix — the same categories of bloat will keep accumulating unless addressed periodically.
Estimated Performance Improvement Query performance improvements vary with how bloated the database has become, but cleanup is rarely wasted effort on a site more than a couple of years old.
Difficulty Easy to Moderate (always back up before running cleanup operations).
23. Unautoloaded / Autoload Options Bloat
Why It Happens WordPress stores site settings and plugin configuration data in the wp_options table, and many of these rows are marked to “autoload” — meaning WordPress loads them into memory on every single page request, whether or not that specific page actually needs them.
How It Slows WordPress Plugins sometimes store large amounts of data (cached API responses, large configuration arrays, logs) with autoload enabled by default, even when that data is rarely if ever needed on a typical page load — this bloats the autoloaded dataset that gets pulled into memory on every request.
Real World Example A plugin that was uninstalled months ago left behind a large autoloaded options entry containing cached data it no longer uses — WordPress still faithfully loads that entire unused blob into memory on every single page request, sitewide.
How To Detect It Query Monitor includes an autoloaded options size indicator directly in its overview panel — a value climbing into the multiple-megabyte range is worth investigating.
Tools To Use Query Monitor; a database optimization plugin with an autoload audit feature.
How To Fix It Identify the largest autoloaded options entries and determine whether they’re still needed; work with a developer to either delete orphaned entries or change unnecessary options from autoload “yes” to “no” where appropriate.
Best Practice Be cautious changing autoload status manually — some options genuinely need to autoload for correct functionality, so verify what each entry actually does before changing it, ideally in staging first.
Estimated Performance Improvement Can meaningfully reduce memory overhead and TTFB on sites where autoload bloat has grown large, though this is a more advanced, higher-risk fix than most on this list.
Difficulty Hard.
24. Heartbeat API Overuse
Why It Happens WordPress’s built-in Heartbeat API powers features like auto-save, post-locking (showing “someone else is editing this”), and live session management — by default, it can send a request to the server as frequently as every 15 seconds while a browser tab with the WordPress admin is open.
How It Slows WordPress Left at default settings across many simultaneously open admin sessions (common on agency-managed multi-editor sites), Heartbeat requests can generate a steady stream of unnecessary server load, competing with actual visitor traffic for the same resources.
Real World Example An agency managing a client’s site leaves several browser tabs open to the WordPress dashboard overnight; the Heartbeat API continues firing requests every 15 seconds from each idle tab, contributing to server load with zero actual benefit since no one’s actively editing anything.
How To Detect It Browser DevTools Network tab, while the WordPress admin is open, will show repeated requests to admin-ajax.php with action=heartbeat at a fixed interval.
Tools To Use Browser DevTools Network tab; a Heartbeat control plugin.
How To Fix It Reduce Heartbeat frequency or disable it entirely on screens where it’s not providing real value (it’s rarely needed outside the post editor), using a lightweight control plugin or a code snippet.
Best Practice Don’t disable Heartbeat entirely if you rely on features like auto-save or post-locking — instead, reduce its frequency and limit it to only the screens where those features matter.
Estimated Performance Improvement Modest on lower-traffic sites, but meaningful on sites with many simultaneous editors or agencies managing dozens of client dashboards at once.
Difficulty Easy.
25. WooCommerce Cart Fragments
Why It Happens WooCommerce’s cart fragments feature uses AJAX to keep the mini-cart icon updated in real time without a full page reload — useful in principle, but by default it fires this AJAX request on every single page load across the entire store, whether or not the cart contents are even displayed on that page.
How It Slows WordPress Each cart fragments request triggers a fairly expensive server-side process to recalculate cart contents, and it happens on every page — including pages with no visible cart element at all, like a simple blog post on the store’s site.
Real World Example A WooCommerce store’s blog section — informational content with no shopping elements visible — still fires a full cart fragments AJAX request on every page load, adding unnecessary server processing time to pages that have nothing to do with the cart.
How To Detect It Browser DevTools Network tab shows a request to admin-ajax.php with action=get_refreshed_fragments firing on page load; check whether it’s firing on pages where no cart UI is even present.
Tools To Use Browser DevTools Network tab; Query Monitor (to see the server-side cost of the fragments request specifically).
How To Fix It Disable cart fragments on pages that don’t need real-time cart updates (blog posts, informational pages), while keeping it active on shop, cart, and checkout pages where it provides real value — several lightweight plugins and code snippets handle this conditionally.
Best Practice Don’t disable cart fragments store-wide without a replacement, since it does serve a real purpose on shopping pages — scope the fix to the pages that don’t need it rather than removing the feature entirely.
Estimated Performance Improvement Can meaningfully reduce server load and improve TTFB specifically on non-shopping pages of a WooCommerce site.
Difficulty Moderate.
IMAGE IDEA: A simple before/after diagram showing a WooCommerce blog page: “before” with an unnecessary cart fragments AJAX call firing in the background, “after” with that call removed and only the essential page assets loading.
Additional Comparison Tables
Cache vs. No Cache
| Attribute | No Cache | Page Cache Enabled |
|---|---|---|
| TTFB (typical) | Several hundred ms to seconds | Tens to low hundreds of ms |
| Server load under traffic spike | High, scales with visitors | Low, largely absorbed by cache |
| Works for logged-in users | N/A (same for both) | Usually excluded by default; needs object cache separately |
| Setup effort | None | Low to moderate |
HTTP/2 vs. HTTP/3
| Attribute | HTTP/2 | HTTP/3 |
|---|---|---|
| Transport protocol | TCP-based | QUIC (UDP-based) |
| Connection setup | Slower on unreliable networks | Faster, especially on mobile/lossy connections |
| Multiplexing | Yes, but can suffer head-of-line blocking | Improved, avoids TCP head-of-line blocking |
| Adoption | Widely supported | Growing rapidly; check your host/CDN support |
Shared Hosting vs. Managed WordPress Hosting
| Attribute | Shared Hosting | Managed WordPress Hosting |
|---|---|---|
| Resource allocation | Often oversold, shared broadly | Typically better isolated/guaranteed |
| Server-level caching | Rarely included | Usually included by default |
| WordPress-specific tuning | Minimal | Extensive (PHP tuning, object caching often included) |
| Price | Lower | Higher |
| Best for | Very small, low-traffic sites | Business, WooCommerce, and higher-traffic sites |
Redis vs. Memcached
| Attribute | Redis | Memcached |
|---|---|---|
| Data persistence | Optional persistence to disk | In-memory only, no persistence |
| Data structure support | Rich (strings, lists, sets, hashes) | Simple key-value only |
| WordPress object caching | Widely supported via plugins | Widely supported via plugins |
| General recommendation | Preferred default for most modern setups | Still solid, simpler, lighter-weight option |
9. WordPress Speed Audit Checklist
Hosting & Server
- TTFB tested and under 200ms on cached pages
- PHP version current and supported
- Object caching (Redis/Memcached) available and enabled if the site has logged-in/dynamic traffic
- Hosting tier matches actual traffic and site complexity
Caching
- Page caching active and correctly configured (verify cache hits via headers)
- Dynamic pages (cart, checkout, account) properly excluded from page cache
Images
- All images sized to their actual maximum display dimensions
- Compression applied (lossy, ~75–85% quality for photos)
- WebP/AVIF served automatically with fallback
Fonts
- Font families consolidated to two or fewer
- Fonts self-hosted rather than pulled from an external domain
font-display: swapapplied
Theme & Front-End Code
- Theme evaluated for unnecessary bulk relative to actual site needs
- Unused CSS/JS audited via DevTools Coverage tab
- DOM size checked (flagging anything above ~1,500 elements)
Plugins
- Full plugin list audited for redundant or unused tools
- Query Monitor run to identify the heaviest plugins by query time
- New plugins evaluated for conditional asset loading before adoption
Third-Party Scripts
- All external scripts reviewed for continued necessity
- Ad slots reserve explicit space to prevent CLS
- Chat widgets loaded conditionally, not sitewide by default
Infrastructure
- DNS provider tested for lookup speed
- CDN active and covering primary visitor geography
Database
- Post revisions, expired transients, and spam cleaned up
- Autoloaded options size checked via Query Monitor
- Heartbeat API frequency reduced or scoped to necessary screens
WooCommerce (if applicable)
- Cart fragments scoped to shopping-related pages only
Measurement
- Baseline recorded (PageSpeed Insights, GTmetrix) before making changes
- Re-tested after each significant change, not just at the end
- Field data (CrUX) checked in addition to lab data

